 Oddbean new post about login | logout
 Bitcoin vs global liquidity: https://m.primal.net/HlgH.png
 This is a typical bullshit graph (see https://www.callingbullshit.org/):
The  y-axis is logarithmic to increase the appearance of a strong correlation.
Why does that make it bullshitty? Percentage changes could be correlated.
Could be yes. I‘m suspiscious though. No source and convenient.
 Here‘s actually the source:
https://www.lynalden.com/bitcoin-network-health/
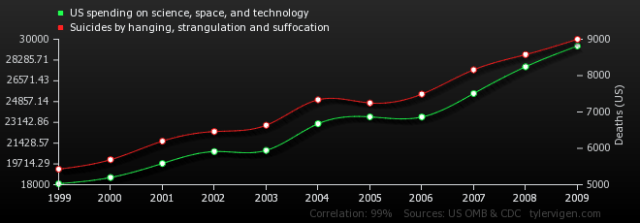
Michael Saylor's thesis includes the idea that M2 is the real measure of USD fiat inflation. I don't know if this idea is quantitatively proven, but on a gut-level it's more probable than the CPI metric. Nevertheless, beware of #spuriouscorrelation https://www.tylervigen.com/spurious-correlations
 I fail to understand this one, despite seeing it in the newsletter every other week.

lhs is logarithmic
rhs is linear

Seems like a flawed comparison, but I don't really grok most of the macro stuff anyway
Bitcoin is on an exponential structural tech/adoption trend, but the cyclical direction of that trend is highly correlated with global liquidity.
Is that correlation more about sentiment than actual monetary value (as the bitcoin axis is exponential)? As there’s more liquidity, people become more comfortable with storing value in the network, perhaps?
I thought the correction was linked to the options market and getting rid of some of the built up leverage.
May be why 2021 looks like volcano with caldera since it blew its leveraged top off ;)
 Maybe my friend. I'm learning to just hold all the way through now.

Stay #nostr 💜
 Correlation doesn't mean 1:1 linear relation.

An observation can be "everytime that A goes up, B follows" and vice versa - even if scales are completely different.

Correlation also doesn't mean causation. It's an observation that Lyn presents here.
Just sayin’
Why is M2 going up even with QT going on?
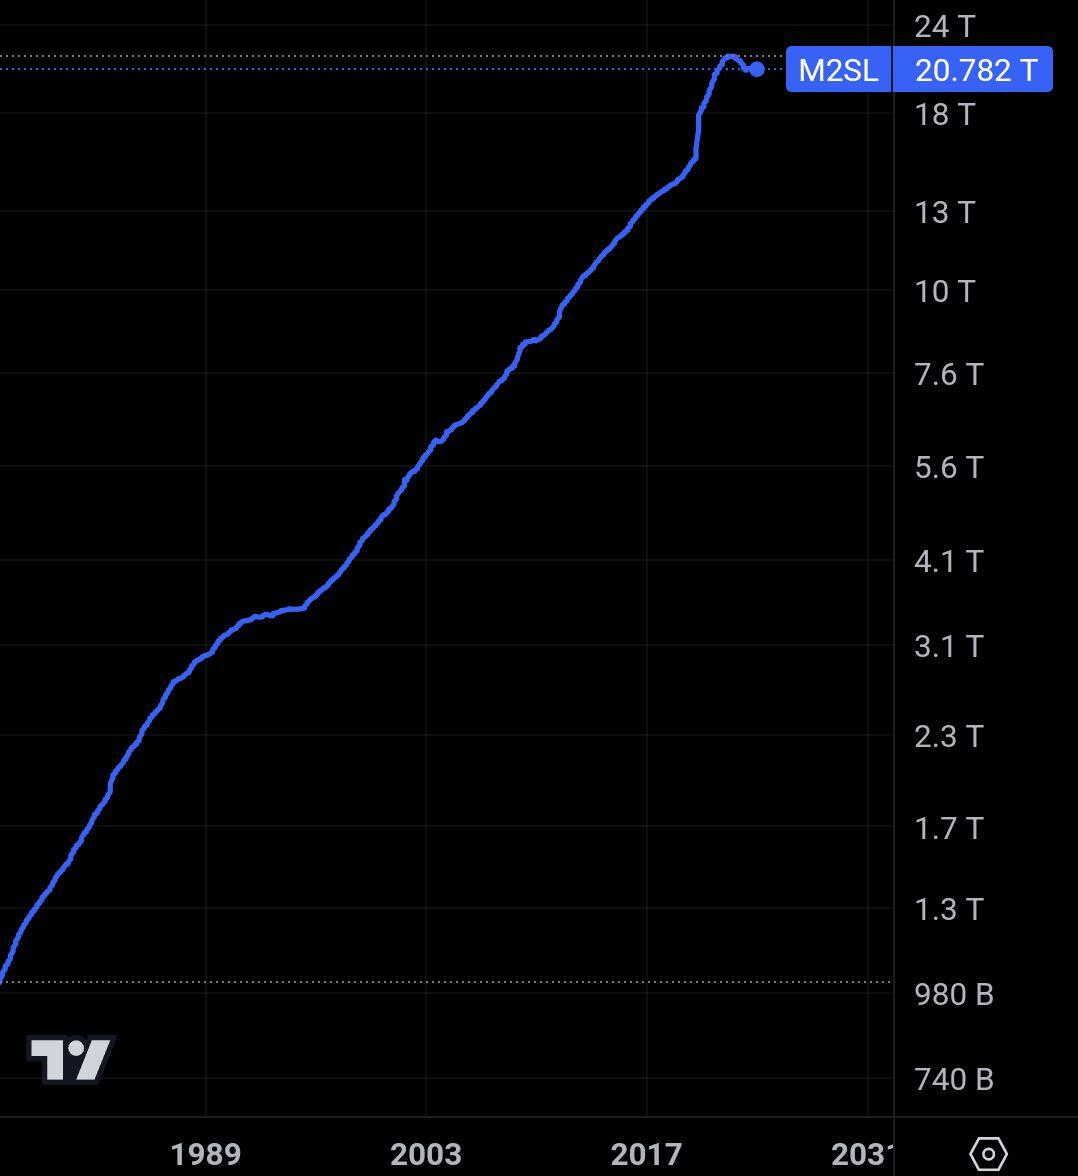
 1) the chart says "global m2". There's actually other countries outside the US, each with their own policy.

2) US M2 is _almost alwys_ rising. The current QT is the tiny blip at the end of the curve.
 https://image.nostr.build/fd043574bf460d532145032fda759e1585e39378d0bbd795245b09724073da0d.jpg
You had a very thoughtful answer to this on Rebel Cap pro. Thanks. Would love to hear a full write up or focused interview with some other heavy hitters on conditions that might decouple BTC from liquidity. My thesis is a melt up to ATHs in all markets…then a massive puke like 08’…Then they print 10-20T…. Everything roars back…Which then triggers the fiat system awakening…Then we see risk adjusted portfolios piling into PMs, BTC, etc. Could take 2 to 10 years with a lot of economic pain and gubment fuckery to navigate along the way.
  @dylan  has a good chart on this also.

https://www.tradingview.com/chart/ugMD3RGy/

I would love to see this adjusted by some alpha geek charter according to what Dr Singh is throwing down with  @caitlinlong in this talk. Not sure how one would calc the hidden liquidity so to speak. He's probably the only who could.

https://www.youtube.com/watch?v=UJsVYOfrc3M
Does M2 follow a power law?
 US M2 follows exponential, not power law.

Exponential growth forms straight lines in log charts. Here's US M2: https://image.nostr.build/fd043574bf460d532145032fda759e1585e39378d0bbd795245b09724073da0d.jpg
I haven't checked, if gobal M2 gollows the same pattern, but I assume so. Debt is exponential by nature.
Bitcoin is in some sense a mirror that reflects the raw truth of the current monetary regime.
 Follow @LynAlden for high signal
nostr:nevent1qy88wumn8ghj7mn0wvhxcmmv9uq3jamnwvaz7tmhv4kxxmmdv5hxummnw3ezuamfdejj7qg7waehxw309ahx7um5wgkhqatz9emk2mrvdaexgetj9ehx2ap0qywhwumn8ghj7mn0wd68ytnzd96xxmmfdejhytnnda3kjctv9uq3xamnwvaz7tmsw4e8qmr9wpskwtn9wvhsz9nhwden5te0wp6hyurvv4ex2mrp0yhxxmmd9uqzpssqng5m7z2j6mj2p50vc6ykkrvt0esszjjwn8se8v2wt9xpj42syuax24
Join https://relay.orange-crush.com for based conversation.